州级Rental Demand显示,整个美国的短租市场已经恢复。
什么是Rental Demand ?
Rental Demand是通过将这个市场的表现与全球排名前2000的Airbnb营销市场进行比较得出的,通过结合年度入住率和上市增长率,显示了这个市场的相对旅游需求。Rental Demand越高,说明旅游需求越高。
【Rental Demand 定义来源于AirDNA】
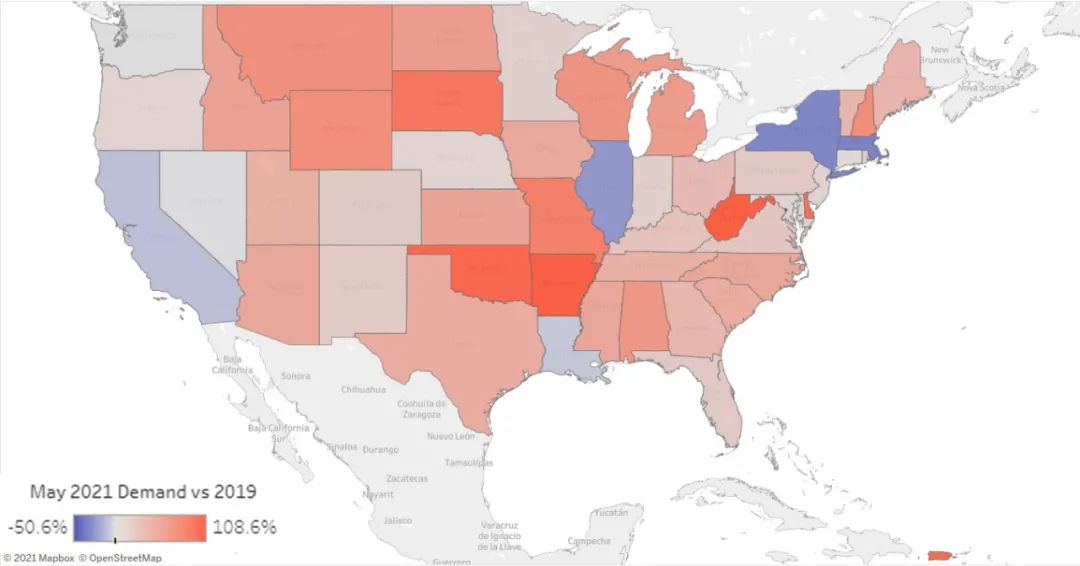
截至2021年五月,在Puerto Rico, and Washington, D.C等50多个州中, 44个州已经超过了2019年的水平,除了其中8个州尚未恢复元气。 在过去的两年里,West Virginia (+109%), Arkansas (+108%), and Oklahoma (+102%) 的短租房需求都增长了一倍多。严重依赖城市市场的 New York (-32%), Massachusetts (-33%), and Washington, D.C. (-51%)尚未恢复。
2021年5月的短租需求跟2019年5月的变化百分比
从入住率来看,5月份入住率最高的是Puerto Rico(76.6%),其次是 Hawaii (76.0%), Alabama (70.5%), South Carolina (70.3%), and Florida (69.7%). 所有州都拥有强劲的沿海休闲市场,入住率达到历史最高。San Juan (83.8%) and Rio Grande/Fajardo (82.4%)是美国市场上仅有的入住率超过80%的州。
文章来源:https://www.airdna.co/blog/airdna-market-review-us-may-2021
什么是Rental Demand ?
Rental Demand是通过将这个市场的表现与全球排名前2000的Airbnb营销市场进行比较得出的,通过结合年度入住率和上市增长率,显示了这个市场的相对旅游需求。Rental Demand越高,说明旅游需求越高。
【Rental Demand 定义来源于AirDNA】
截至2021年五月,在Puerto Rico, and Washington, D.C等50多个州中, 44个州已经超过了2019年的水平,除了其中8个州尚未恢复元气。 在过去的两年里,West Virginia (+109%), Arkansas (+108%), and Oklahoma (+102%) 的短租房需求都增长了一倍多。严重依赖城市市场的 New York (-32%), Massachusetts (-33%), and Washington, D.C. (-51%)尚未恢复。
2021年5月的短租需求跟2019年5月的变化百分比
| 排名 | 城市 | 百分比 |
| 1 | West Virginia | 108.60% |
| 2 | Arkansas | 108% |
| 3 | Oklahoma | 101.80% |
| 4 | Delaware | 94.30% |
| 5 | South Dakota | 91.70% |
| 6 | Missouri | 83.30% |
| 7 | New Hampshire | 73.50% |
| 8 | Wyoming | 72.90% |
| 9 | Montana | 70.40% |
| 10 | Wisconsin | 67.70% |
| 11 | Alabama | 65.10% |
| 12 | Alabama | 65.10% |
| 13 | Michigan | 61.60% |
| 14 | North Dakota | 60.60% |
| 15 | Idaho | 55.10% |
| 16 | Kansas | 52.90% |
| 17 | North Carolina | 50.90% |
| 18 | Mississippi | 50.70% |
| 19 | Arizona | 50.10% |
| 20 | Lowa | 49.50% |
| 21 | Texas | 47.80% |
| 22 | South Carolina | 46.60% |
| 23 | Utah | 43.80% |
| 24 | Tennessee | 43.70% |
| 25 | Maine | 39.60% |
| 26 | Georgia | 37.20% |
| 27 | Vermont | 37.10% |
| 28 | Ohio | 34.20% |
| 29 | Kentucky | 25.40% |
| 30 | Virginia | 22.90% |
| 31 | Floria | 19.50% |
| 32 | Pennsylvania | 19.00% |
| 33 | New Mexico | 18.90% |
| 34 | Colorado | 18.10% |
| 35 | Rhode Island | 15% |
| 36 | Indiana | 14.60% |
| 37 | Minnesota | 13.50% |
| 38 | Oregon | 10.20% |
| 39 | Nebraska | 9.70% |
| 40 | Maryland | 9.60% |
| 41 | Maryland | 9.60% |
| 42 | New Jersey | 8.40% |
| 43 | Connecticut | 4.60% |
| 44 | Washington | 0.40% |
| 45 | Nevada | -0.90% |
| 46 | Louisiana | -7.30% |
| 47 | California | -10.30% |
| 48 | Ilinois | -24.90% |
| 49 | New York | -31.50% |
| 50 | Massachusetts | -32.60% |
文章来源:https://www.airdna.co/blog/airdna-market-review-us-may-2021